

Built with Noodles.gl
Animated maps, data-driven storytelling, and publication-quality renders — all from visual pipelines
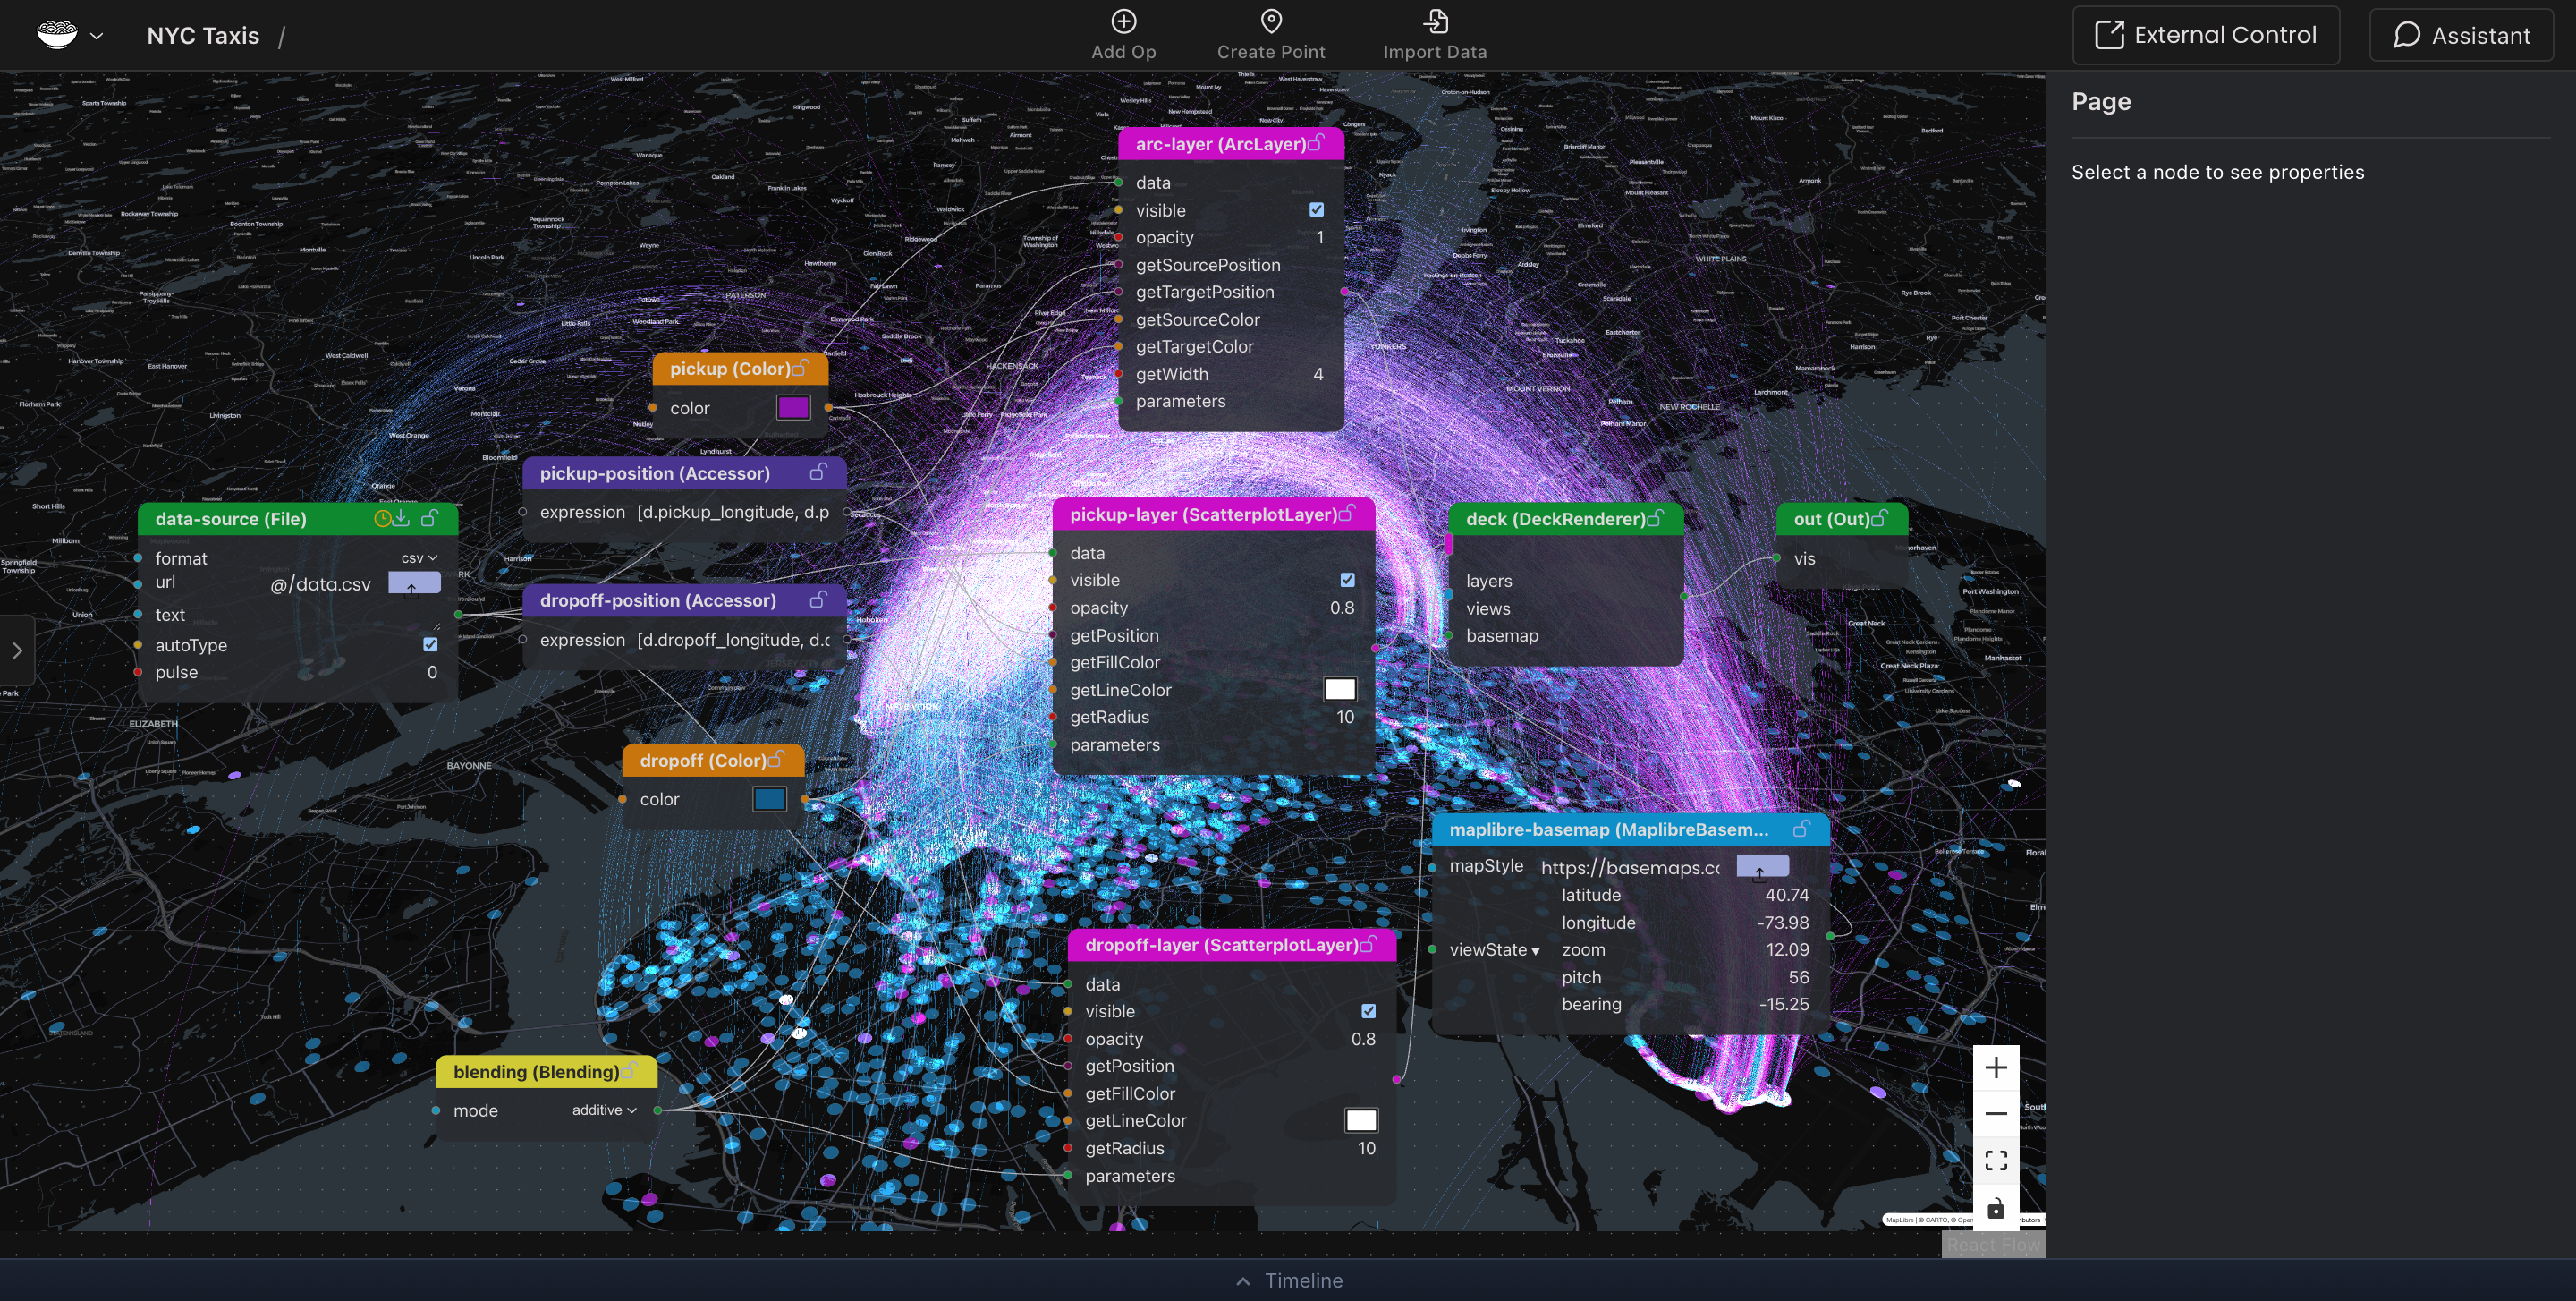
NYC Taxi Trips
Animated arc flows across 1M+ trips with real-time brushing and filtering
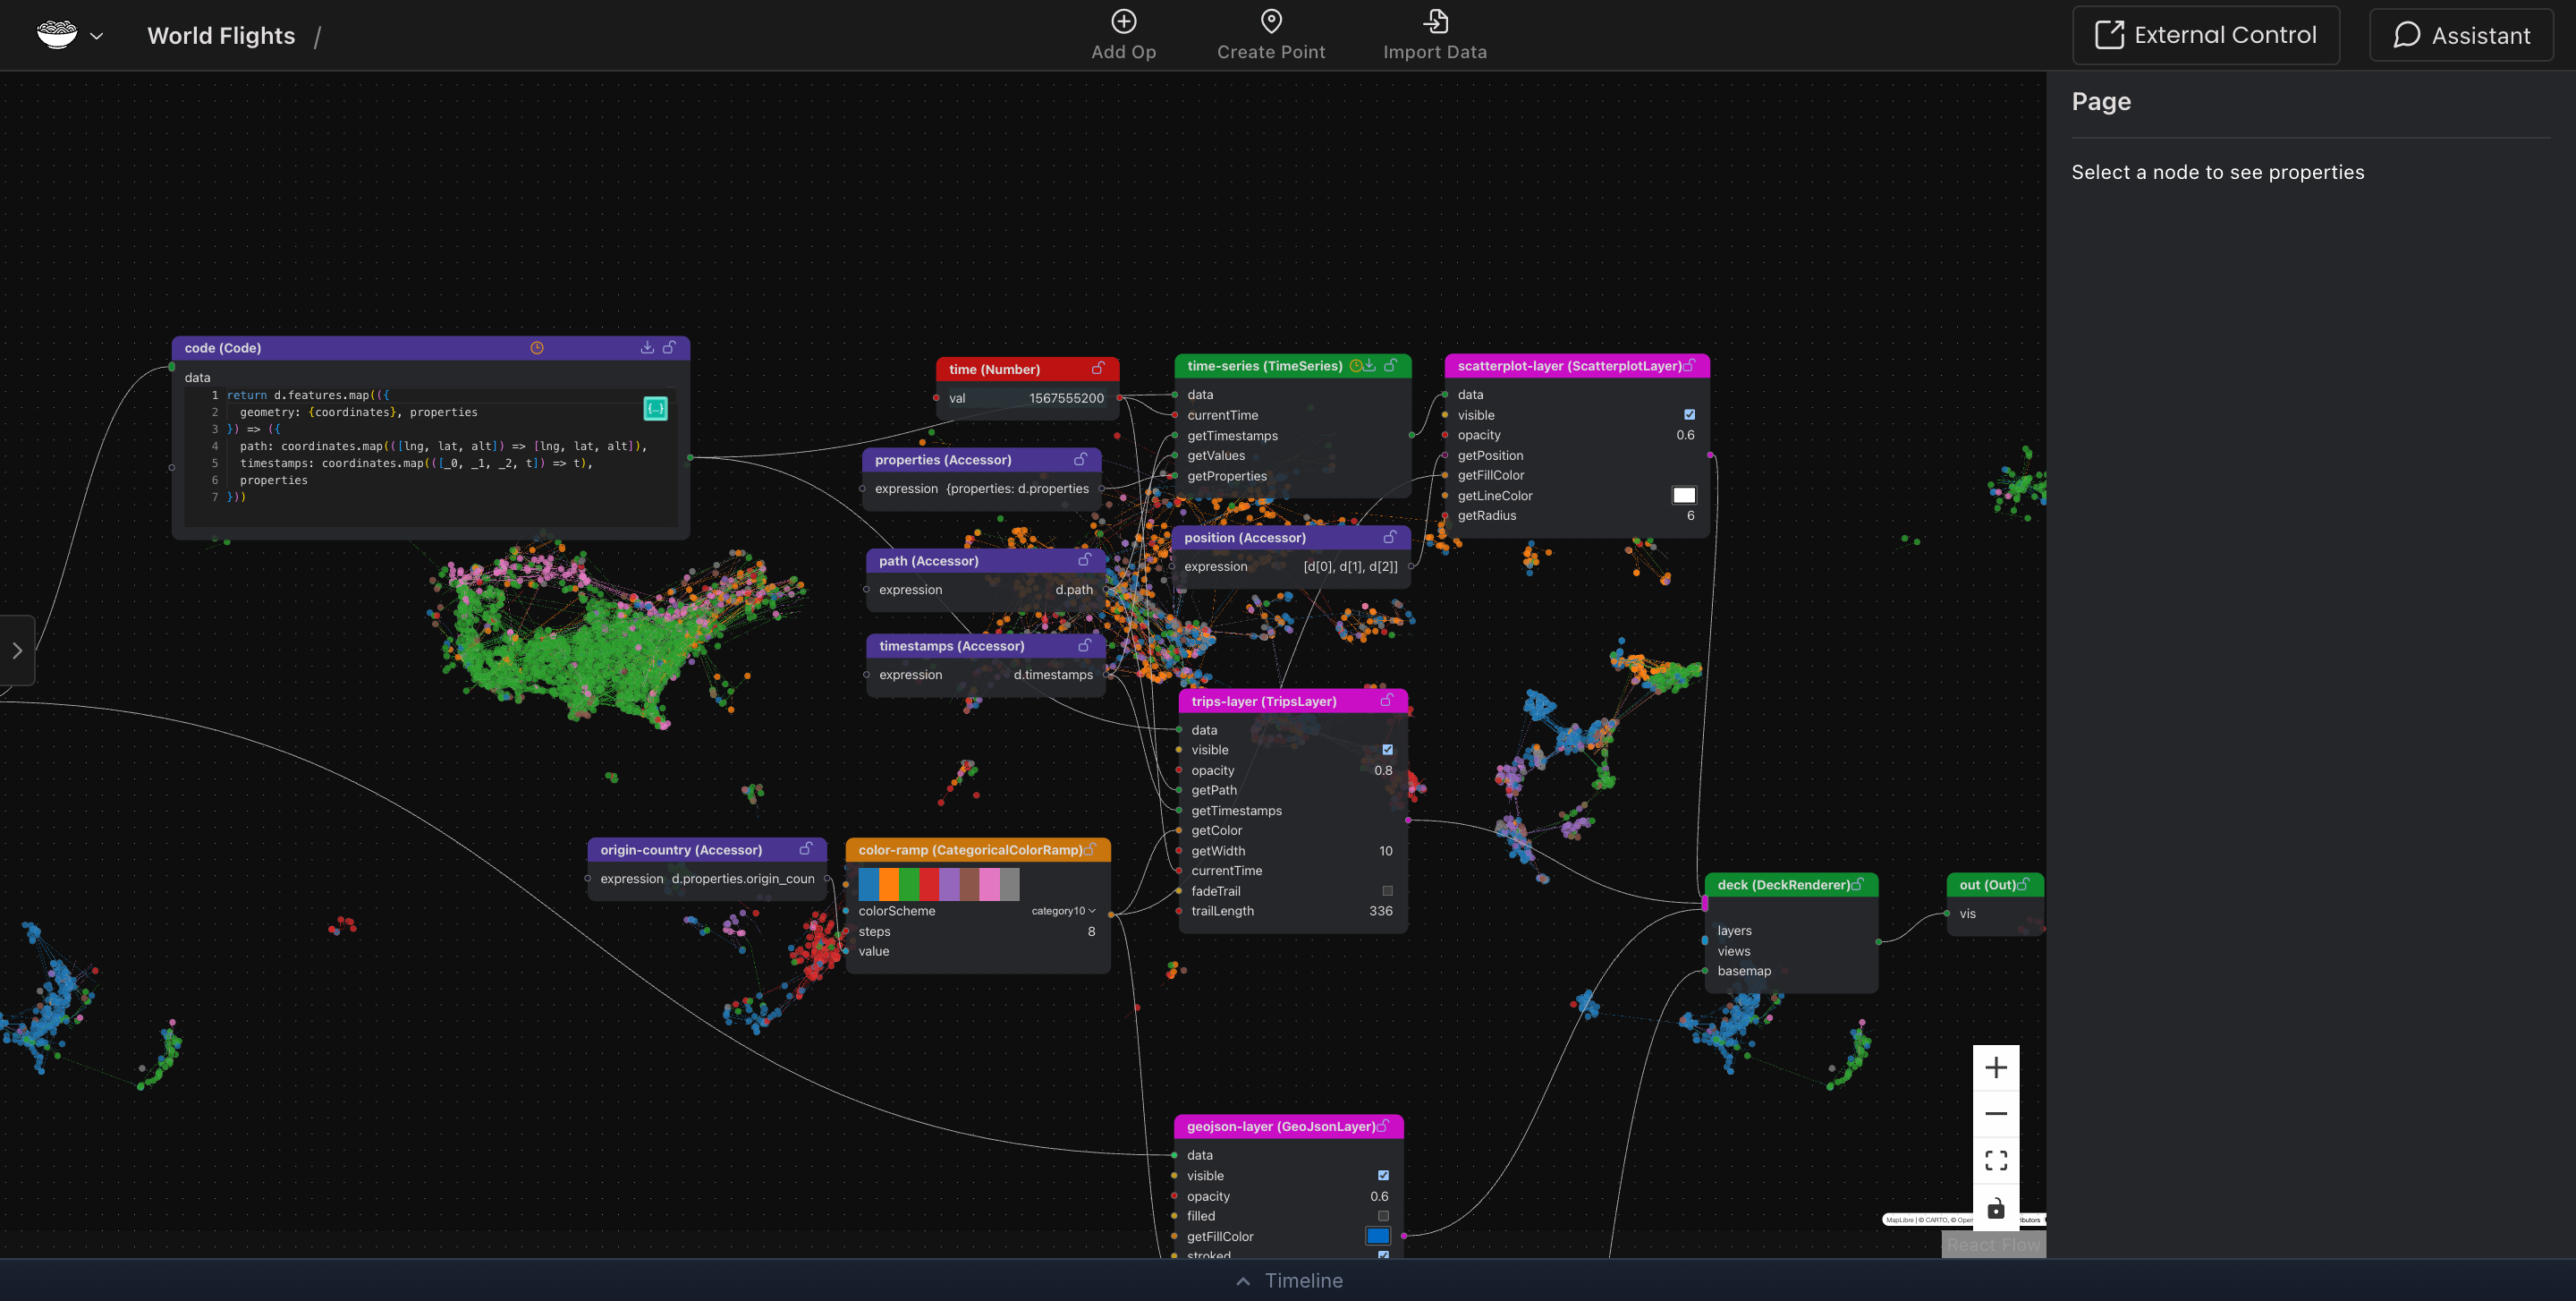
World Flights
Arc layer with camera flythrough, animated by timestamp and colored by airline

EV Charging Network
Live DuckDB query drives a heatmap that updates as filters change
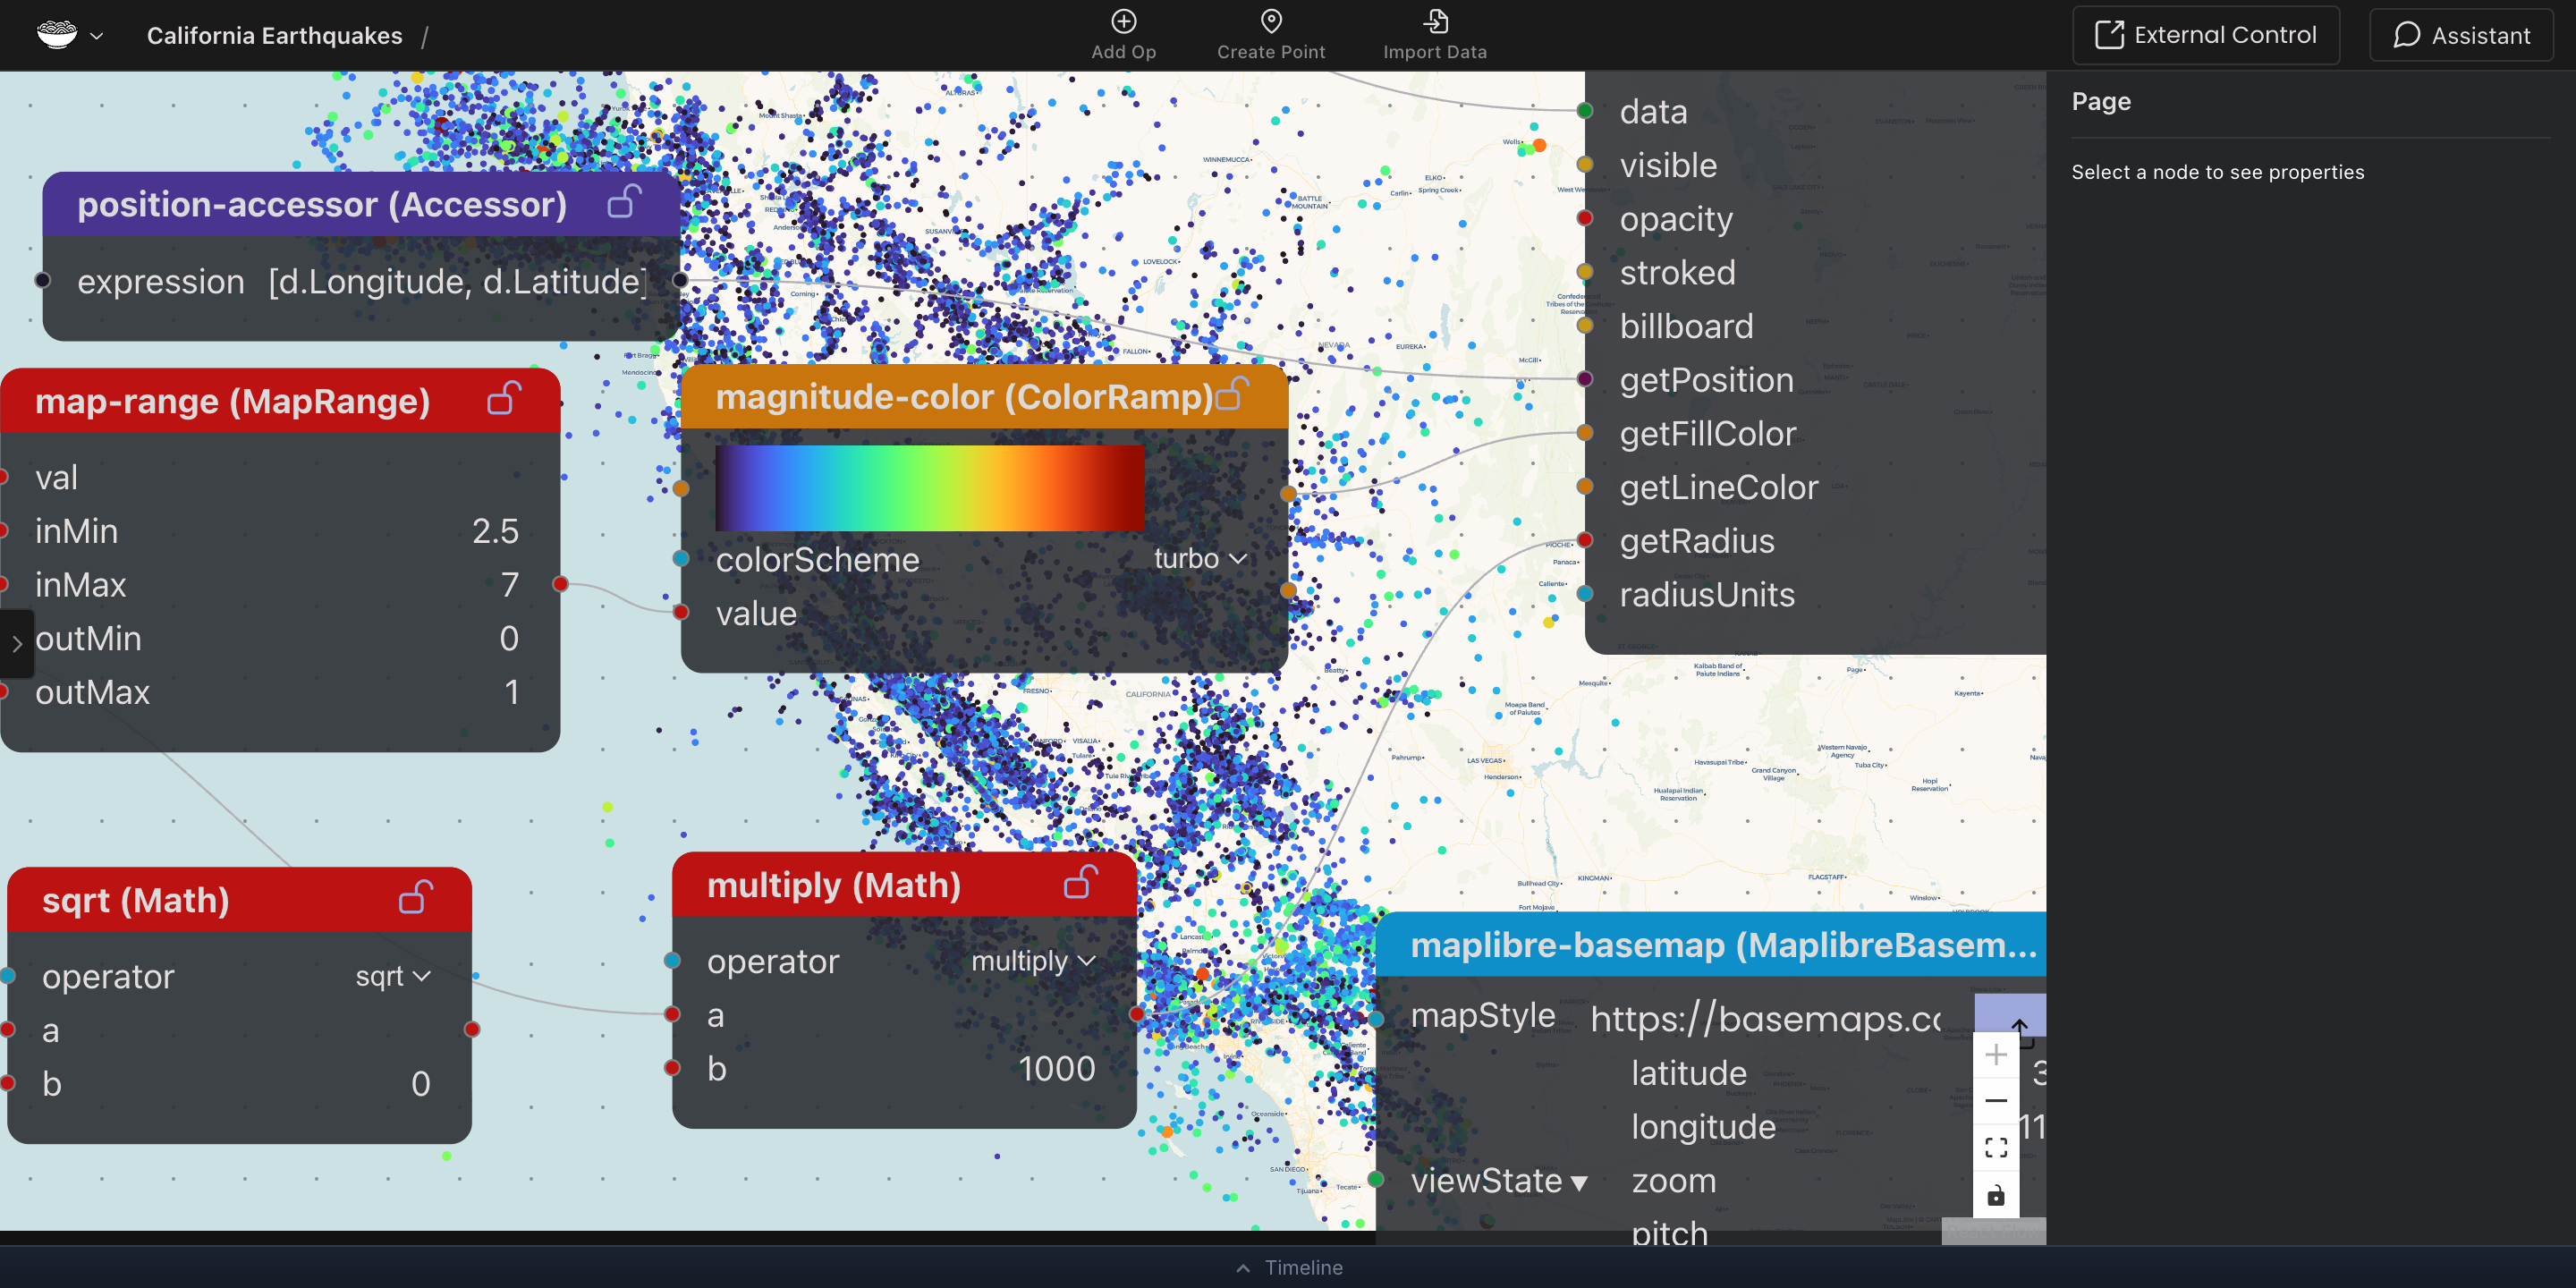
California Earthquakes
Magnitude-scaled scatter with animated time window and turbo color ramp
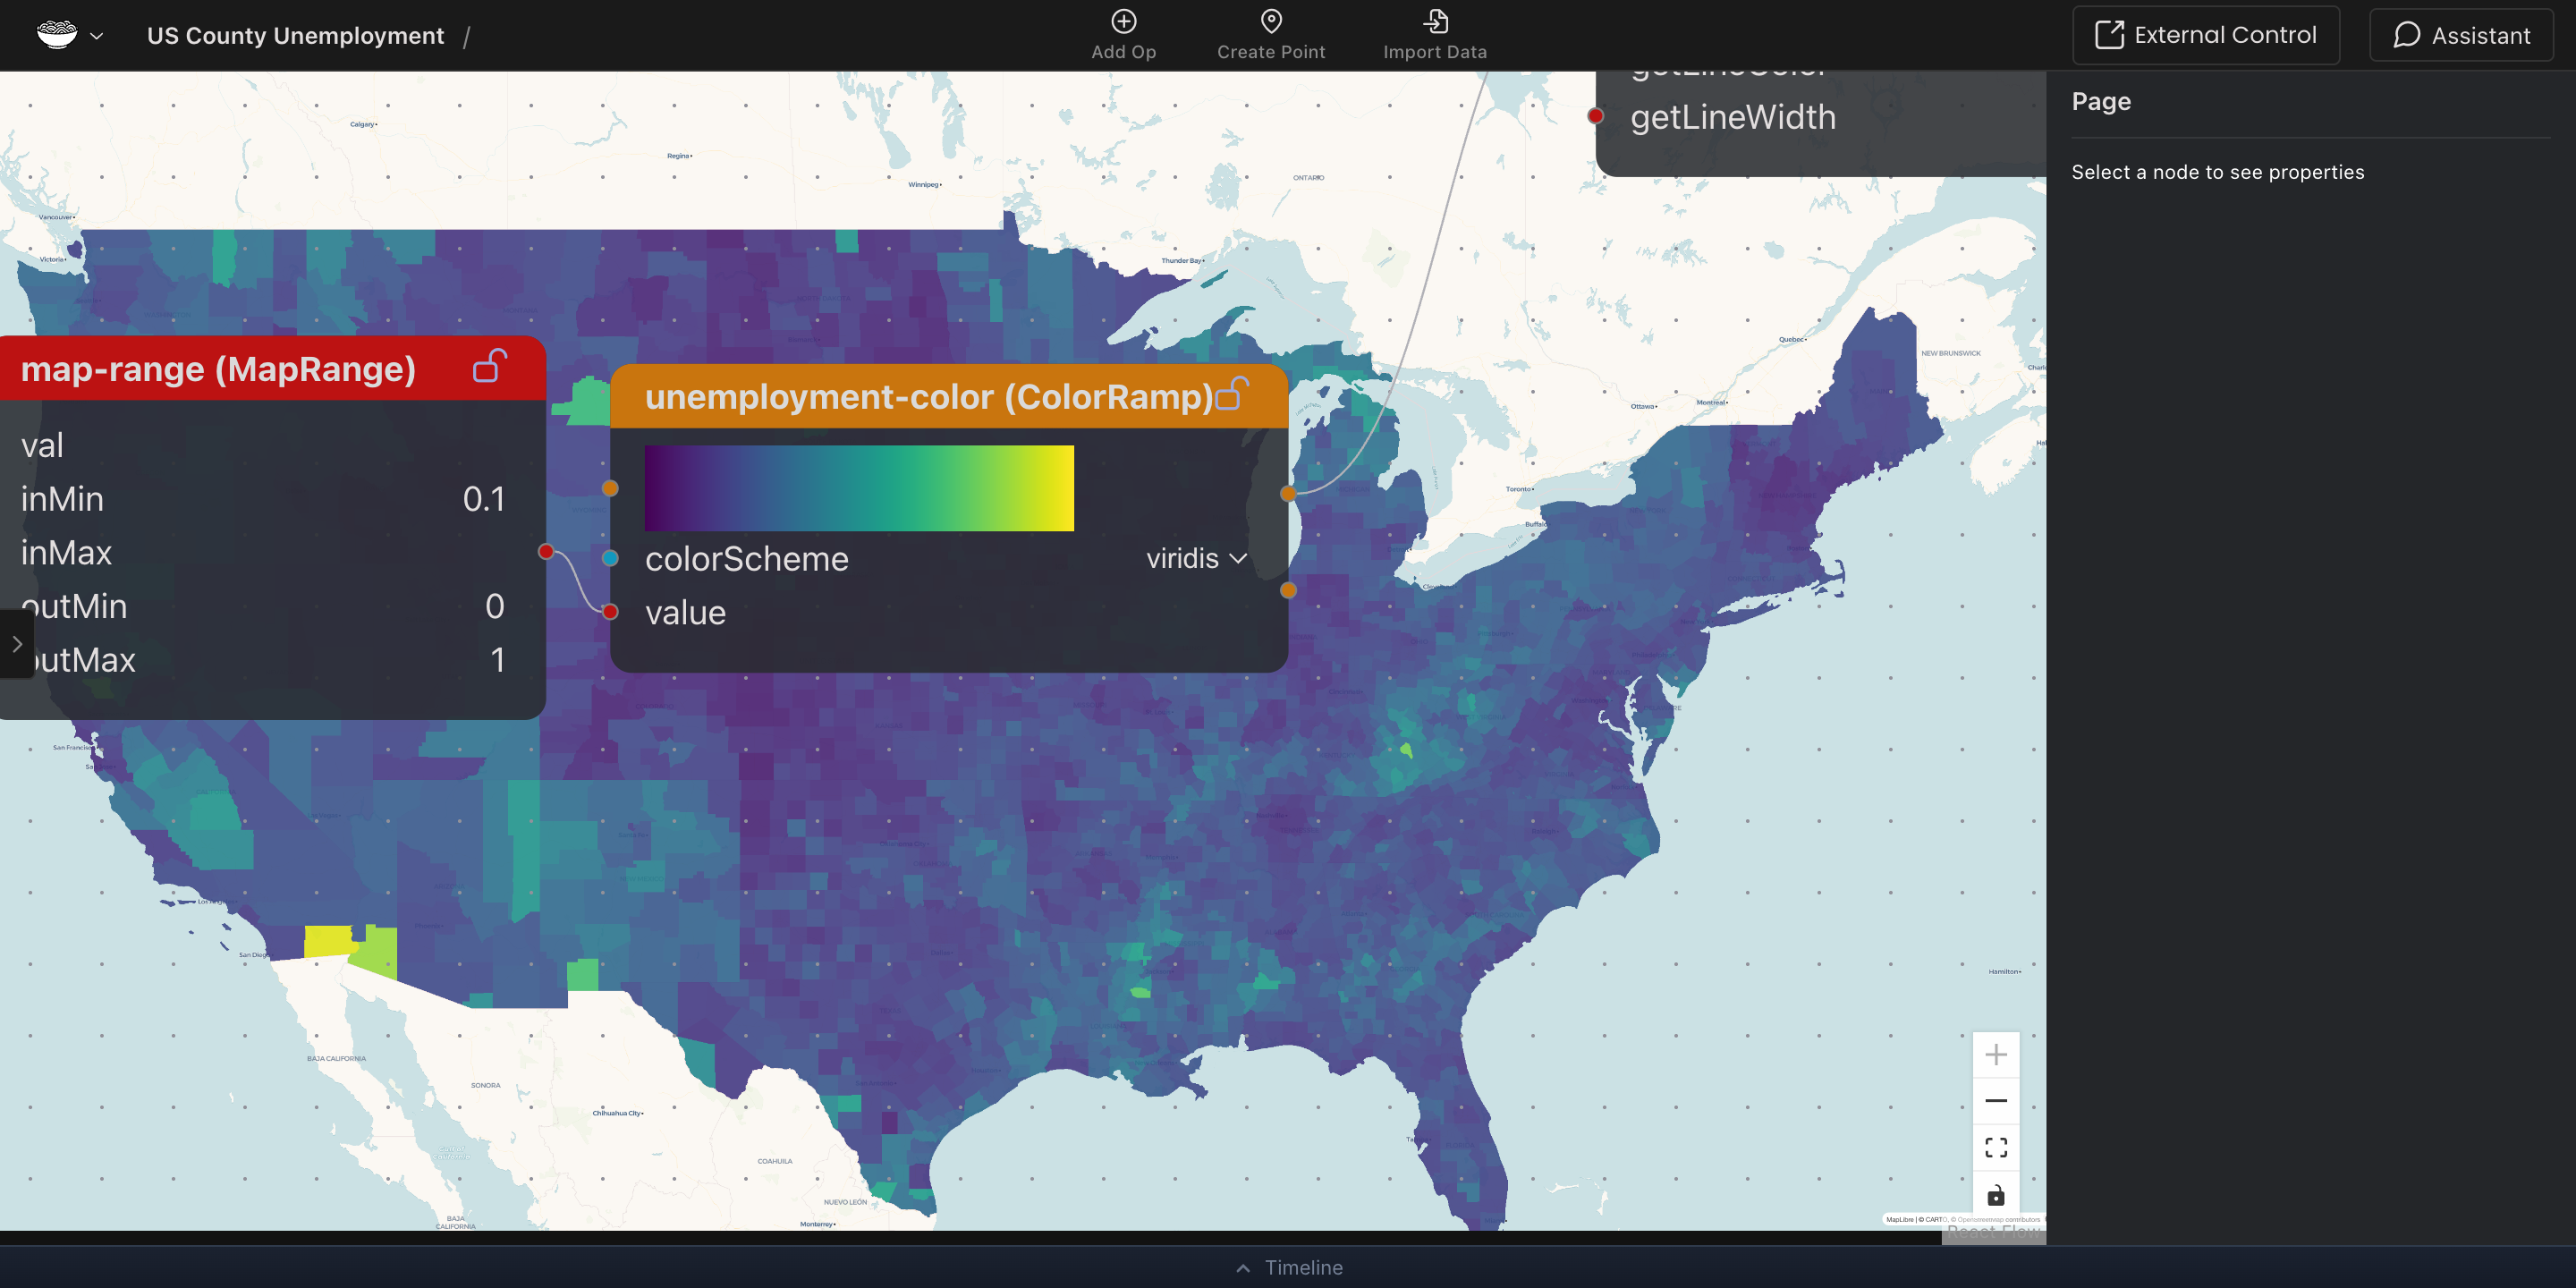
US County Unemployment
Choropleth driven by SQL, exportable as print-resolution image or video
Use with your AI agent
Paste one prompt into your coding agent. It installs Noodles.gl, opens an example map, changes it, and shows you a screenshot. About 3 minutes. Other ways to use Noodles with an agent.
- Claude Code
- Codex, Gemini CLI, Cursor, others
Set up Noodles.gl (https://github.com/joby-aviation/noodles.gl) on this machine, open an example map, make one small change to it, and show me a screenshot. Follow these steps in order. Don't research beyond them.

1. Repo: if the current directory has a `noodles-editor/` folder, use it. Otherwise run `git clone --depth 1 https://github.com/joby-aviation/noodles.gl.git` (reuse `./noodles.gl` if it exists) and work in it. Needs git, Node 22 or later, and Chrome or Edge.
2. Install: run `npm install` in the repo root.
3. Dev server: run `npm start` in `noodles-editor/` as a background process. Wait for the `Local:` URL it prints (often http://localhost:5173/) and use it as <URL> below.
4. Relay: in the repo root, run `claude mcp add webmcp -- npx -y @mcp-b/webmcp-local-relay@4`, unless `claude mcp get webmcp` already finds it.
5. Change and capture: this session can't use the relay until Claude Code restarts, so run a second session in the repo root. It loads the relay and the repo's `noodles-live` skill, then opens the map, because a tab opened before the relay starts never connects. First tell me a browser tab will open and to leave it visible until you show the screenshot. Then run:
   `mkdir -p .quick-start && claude -p --allowedTools "mcp__webmcp Skill Bash(sleep *) Bash(<open> *)" --output-format stream-json --verbose "Use the noodles-live skill. Run <open> '<URL>examples/nyc-taxis?externalControl=true'. Call webmcp_list_sources; if no tab URL starts with <URL>examples/nyc-taxis yet, run sleep 5 and check again, up to 6 times. Use that tab; with several tabs, its tool names end in a tab id. Call get_current_project. Make one small visible change to a layer, such as its color. Call capture_visualization, then reply with one sentence on what changed. Stop there." >| .quick-start/run.jsonl`
   For <open>, use `open -a 'Google Chrome'` on macOS (`open -a 'Microsoft Edge'` if Chrome isn't installed), `xdg-open` on Linux, or `start chrome` on Windows (`start msedge` without Chrome).
   If it reports that the tab is hidden, bring the browser to the front and run it once more. If it reports no tab, close the Noodles tabs it opened and run it once more.
6. Screenshot: save the last image from that run with
   `node -e "let d;for(const l of require('fs').readFileSync('.quick-start/run.jsonl','utf8').split('\n'))JSON.stringify(JSON.parse(l||'{}'),(k,v)=>(v&&v.type==='image'&&v.source&&(d=v.source.data),v));require('fs').writeFileSync('.quick-start/screenshot.jpg',Buffer.from(d,'base64'))"`
   then read `.quick-start/screenshot.jpg` so I can see it.

You are done when you have shown me the screenshot, said what changed, and given me the file path. Then stop. If a step fails twice, stop and tell me the step and its exact error.

End your last message with: to keep going, run `claude` in the repo folder and ask for a change, for example "make the arcs red and export a 5 second video". The relay and the noodles-live skill load there on their own. Open the editor after Claude Code starts, so the tab finds the relay.
Needs Claude Code, git, Node 22 or later, and Chrome or Edge. For agents: llms.txt and the prompt as text.
Set up Noodles.gl (https://github.com/joby-aviation/noodles.gl) on this machine, connect it to you, open an example map, make one small change to it, and show me a screenshot. Follow these steps in order. Don't research beyond them. Steps that are already done are skipped, so this prompt is safe to paste again.

1. Repo: if the current directory has a `noodles-editor/` folder, use it. Otherwise run `git clone --depth 1 https://github.com/joby-aviation/noodles.gl.git` (reuse `./noodles.gl` if it exists) and work in it. Needs git, Node 22 or later, and Chrome or Edge.
2. Install: run `npm install` in the repo root, unless `node_modules/` is already there.
3. Relay: register the WebMCP relay as a stdio MCP server named `webmcp` that runs `npx -y @mcp-b/webmcp-local-relay@4`. Skip this if you already have a `webmcp_list_sources` tool (your client may prefix the name). Use the line for the agent you are:
   - Codex: `codex mcp add webmcp -- npx -y @mcp-b/webmcp-local-relay@4`
   - Gemini CLI: `gemini mcp add webmcp npx -y @mcp-b/webmcp-local-relay@4`, run in the repo root
   - Claude Code: `claude mcp add webmcp -- npx -y @mcp-b/webmcp-local-relay@4`, run in the repo root
   - Cursor: add `"webmcp": {"command": "npx", "args": ["-y", "@mcp-b/webmcp-local-relay@4"]}` under `mcpServers` in `.cursor/mcp.json` in the repo root
   - VS Code: add `"webmcp": {"type": "stdio", "command": "npx", "args": ["-y", "@mcp-b/webmcp-local-relay@4"]}` under `servers` in `.vscode/mcp.json` in the repo root
   - Anything else: your client's MCP config, with that command and those args
4. Restart: most agents load MCP servers only when they start. If you have no `webmcp_list_sources` tool now, stop here and tell me, in one short message, to quit you, start you again in the repo folder, and paste this same prompt. Don't start the dev server or open a browser first.
5. Dev server: if http://localhost:5173/ already serves Noodles.gl, use it. Otherwise run `npm start` in `noodles-editor/` as a background process and wait for the `Local:` URL it prints. Use that URL as <URL> below.
6. Open: tell me a browser tab will open and to leave it visible until you show the screenshot. Then run <open> '<URL>examples/nyc-taxis?externalControl=true'. For <open>, use `open -a 'Google Chrome'` on macOS (`open -a 'Microsoft Edge'` if Chrome isn't installed), `xdg-open` on Linux, or `start chrome` on Windows (`start msedge` without Chrome).
7. Connect: call `webmcp_list_sources`. If no tab URL starts with <URL>examples/nyc-taxis yet, wait 5 seconds and check again, up to 6 times. Use that tab; with several tabs, its tool names end in a tab id. If it never shows up, close the Noodles tabs you opened and do step 6 once more.
8. Change: read `.claude/skills/noodles-live/SKILL.md` in the repo and follow it (it may already be loaded as a skill). Call `get_current_project`. Make one small visible change to a layer, such as its color. Call `capture_visualization`. If it reports that the tab is hidden, ask me to bring the browser to the front, then call it once more.

You are done when you have shown me the screenshot (or, if you can't show images, described it) and said in one sentence what changed. Then stop. If a step fails twice, stop and tell me the step and its exact error.

End your last message with: to keep going, ask me for a change, for example "make the arcs red and export a 5 second video". The relay is registered for next time. Start me first, then the editor (`npm start` in `noodles-editor/`), then open the map with `?externalControl=true`, so the tab finds the relay.
Needs an agent that can run shell commands and use MCP servers, plus git, Node 22 or later, and Chrome or Edge. Most agents need one restart partway through; the prompt tells you when. For agents: llms.txt and the prompt as text.
Static maps tell facts. Animated maps tell stories.
Most mapping tools stop at the screenshot. Noodles.gl starts there — giving you a full keyframe timeline, reactive data pipelines, and cinema-quality GPU rendering to turn spatial data into narrative.
Timeline-first design
Every parameter in your visualization is animatable. Camera position, arc height, filter threshold, color ramp midpoint — set keyframes, adjust bezier curves, scrub through time. The workflow motion designers already know, applied to maps.
Reactive, not static
Wire a DuckDB query to a heatmap layer. Change the WHERE clause and the map updates in the same frame. Chain ten transforms together — the whole pipeline stays live. No re-runs, no stale caches.
40+ GPU layer types
Arcs, trips, hexagons, heatmaps, point clouds, 3D columns, contours, great circles, icon clusters — each rendered at 60fps on the GPU via Deck.gl. Handle millions of data points without dropping frames.
Export anything
MP4 video at any framerate and resolution. High-DPI PNG stills for print. Interactive embeds for the web. Or drive the visualization live from external tools via the MCP API.
See it in action
From raw data to cinematic map animation — the full workflow in under 5 minutes
What you can do with it
Keyframe everything
Camera position, layer opacity, filter thresholds, colors, radii — every parameter is animatable. Scrub with a professional timeline editor, shape curves with bezier handles, and export directly to video.
Reactive data pipelines
Wire a SQL query to a map layer; when the query changes, the map updates instantly. Chain transforms, filters, and visual encodings as a live graph — no run button, no waiting.
Cinema-quality map renders
40+ GPU-accelerated layer types: arcs, heatmaps, hexagons, trip animations, 3D columns, point clouds. Export at any resolution — 4K video, print-ready stills, or interactive web embeds.
Ship it, share it, replay it
Every project is a portable JSON file. Hand it to a colleague — they get the exact same visualization, data pipeline, and animation. No environment drift, no missing dependencies.
Visual data pipelines
Connect operators like building blocks — data flows through the graph and the map updates live.
Load your data
CSV, GeoJSON, GeoParquet, live APIs, or SQL queries via DuckDB
Compose the pipeline
Chain transforms, pick a layer type, configure visual encodings — all with drag-and-drop
Animate and export
Keyframe any value, scrub the timeline, then export to MP4, high-res PNG, or interactive embed
Your data deserves motion
Open-source, runs entirely in the browser, no install required.