Introduction to Workflows
Learn the fundamentals of creating data visualizations using Noodles.gl's node-based workflow system.
What is a Workflow?
A workflow in Noodles.gl is a visual program made up of connected operators (nodes) that transform data from inputs to outputs. Think of it as a pipeline where data flows left to right, getting processed, filtered, and visualized along the way.
You work on an infinite canvas where you can freely arrange and organize operators, zoom in and out, and navigate through complex workflows without running out of space.
The Basic Workflow Structure
Every workflow follows a simple pattern:
Data Sources → Processing → Visualization → Output
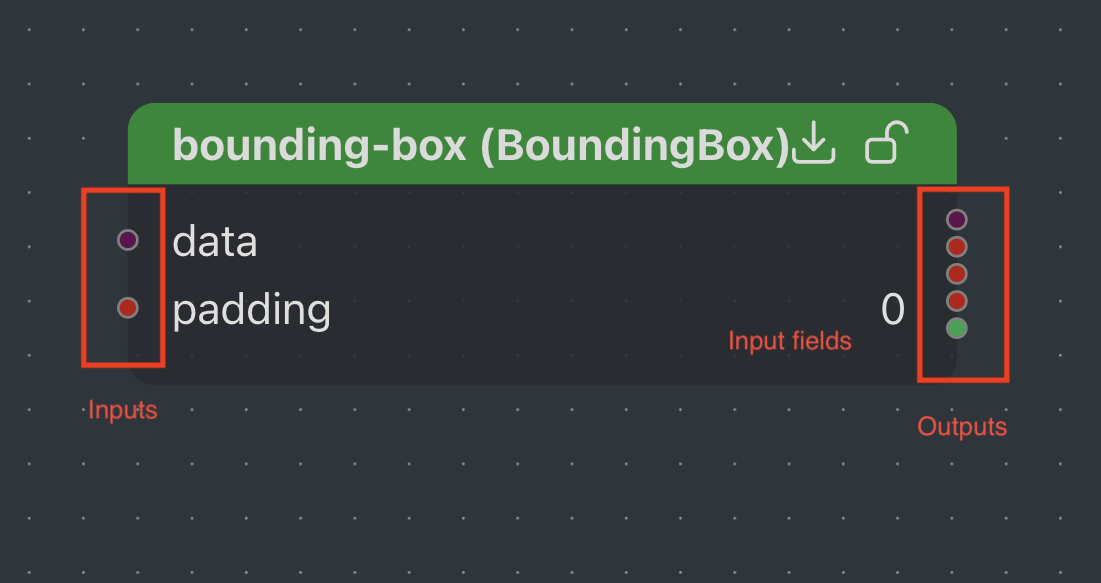
Key Principle: Inputs on the Left, Outputs on the Right
This is the fundamental layout rule in Noodles.gl. Every operator follows this convention:
- Left handles (inputs): Receive data from other operators
- Right handles (outputs): Send data to other operators
This consistent design makes it easy to trace how data flows through your visualization.
Core Concepts
Operators (Nodes)
Operators are the building blocks of your workflow. Each operator performs a specific function:
- Data Operators: Load and fetch data (JSON, CSV, APIs)
- Transform Operators: Filter, sort, map, and manipulate data
- Visualization Operators: Create maps, charts, and layers
- Utility Operators: Math, colors, text formatting, and more
To add an operator:
- Right-click on the canvas or press
a(for "add") - Search for the operator you need
- Click to add it to the canvas
Fields
Fields are the individual parameters on each operator. They come in two types:
Input Fields (left side):
- Accept values from connections or manual entry
- Can be configured in the Properties Panel
- Can be animated with keyframes
Output Fields (right side):
- Produce values after the operator executes
- Can be connected to other operators' inputs
- Automatically update when inputs change
Connections
Connections are the wires between operators that carry data.
To create a connection, click and drag from an output handle and drop onto an input handle. The connection is created and data starts flowing.
Inserting Nodes into Connections
Drag a node onto an existing edge (connection wire) to insert it between the connected operators. The system automatically finds compatible input/output field pairs and rewires the connections. This works like node insertion in Houdini, Blender, or TouchDesigner.
Connection Validation
Noodles.gl allows connections between any fields, but warns about type mismatches:
- Compatible connections: Created normally with no warnings
- Incompatible connections: Allowed but display a warning icon on the node header
Hover over the warning icon to see which connections have type mismatches. This permissive approach lets you experiment while still alerting you to potential issues.
Reactive Execution
Workflows in Noodles.gl are reactive, meaning:
- Changes automatically propagate through the entire workflow
- When you modify an input, all downstream operators update instantly
- No need to manually refresh or recalculate
This makes experimentation fast and intuitive.
Building Your First Workflow
Let's build a simple workflow to visualize data on a map:
Step 1: Add a Data Source
Start by loading your data:
[File] → (outputs: data)
- Right-click and search for "JSON Fetch". You should see the
FileOpoperator. Click it and add it to the canvas. - Configure the format (JSON or CSV) and URL in the Properties Panel
- The output contains your loaded data
Step 2: Transform the Data (Optional)
Process your data as needed:
[File] → [Filter] → (outputs: filtered data)
- Add a "Filter" operator
- Connect the File output to the Filter input
- Configure your filter conditions, e.g., for data with a numeric
valueproperty you might set thecolumnNametovalue,conditiontogreater than, andvalueto100.
Step 3: Visualize
Create a visualization layer:
[Filter] → [ScatterplotLayer] → [DeckRenderer] → [Out]
- Add a "ScatterplotLayer" operator for point data
- Connect the filtered data to the layer's data input
- Connect the layer to the DeckRenderer's layers input
- Add an Accessor operator to define how to extract positions from each row of your data and connect it to the layer's
getPositionfield. For example, use an expression like[d.longitude, d.latitude].dis a special value representing the data row.
Step 4: Style and Configure
Use the Properties Panel to:
- Adjust colors, sizes, and opacity
- Reorder inputs to list fields, such as layers
- Keyframe parameters for animation
Workflow Organization
Containers
For complex workflows, use Container operators to organize related nodes:
- Keep your workflow clean and modular
- Collapse containers to hide complexity
- Navigate using breadcrumbs or press
uto go up one level
Node Tree Sidebar
The left sidebar shows a hierarchical view of all operators in your workflow:
- Toggle visibility: Click the chevron button on the sidebar edge to collapse or expand
- Select nodes: Click a node name to select and highlight it on the canvas
- Navigate to node: Click the compass icon to zoom the canvas to that node
- Navigate into containers: Click the arrow icon on container nodes to enter them
- Rename operators: Double-click any node name to edit it inline (press Enter to confirm, Escape to cancel)
Color-coded borders indicate operator categories (Data, Visualization, Transform, etc.).
Best Practices
- Arrange nodes clearly: Keep your workflow organized and easy to follow
- Group related operations: Use containers for logical sections
- Name your nodes: Give operators descriptive names for clarity (double-click the title)
- Start simple: Build incrementally, testing at each step
- Use viewer nodes: Add "Viewer" operators to inspect data at any stage
Data Flow Patterns
Linear Pipeline
The simplest pattern - data flows through a series of transformations:
[Source] → [Transform A] → [Transform B] → [Output]
Split and Merge
Process data in parallel paths, then combine:
              → [Transform A] →
[Source] →                        → [Merge] → [Layer] → [DeckRenderer] → [Out]
              → [Transform B] →
Multi-Output
One source feeding multiple independent visualizations:
              → [Layer A] → [DeckRenderer A]
[Source] →                                   → [Out]
              → [Layer B] → [DeckRenderer B]
Switch
Use a SwitchOp to route data based on an index or condition. You can dynamically change which path the data takes and even reuse the same index across multiple switches to create complex reusable workflows.
[Source A] →
              [SwitchOp] → [Layer] → [DeckRenderer] → [Out]
[Source B] →    ↑
        (index input)
Common Operators
Here are operators you'll use frequently:
Data Sources
- File: Load JSON or CSV from a URL or text
- JSON: Parse JSON from text with templating support
- DuckDb: Execute SQL queries on your data
- Number/String/Boolean/Date: Create constant values
Transforms
- Filter: Keep only rows matching criteria
- Sort: Order your data
- Slice: Select a subset of rows
- Merge: Combine multiple data sources
- Accessor: Create accessor functions for layers
- Expression: Write custom JavaScript expressions
Visualization Layers
All deck.gl layers are available, including:
- ScatterplotLayer: Points on a map
- PathLayer: Lines and routes
- GeoJsonLayer: Polygon and complex geometries
- ArcLayer: Great circle arcs between points
- TextLayer: Labels and text annotations
- HeatmapLayer: Heat maps from point data
Views
- MapView: 2D/3D map renderer
- GlobeView: Globe visualization
- FirstPersonView: First-person perspective
- OrbitView: 3D orbital camera
Utilities
- Viewer: Inspect data at any stage
- TableEditor: View and edit tabular data
- Container: Organize related operators
- Switch: Route data based on index
- Color: Create and manipulate colors
- MapRange: Scale values between ranges
Tips for Success
- Use the Properties Panel: Most operator configuration happens here
- Inspect data: Use Viewer nodes or the TableEditor to see your data
- Lock nodes: Click the lock icon to prevent accidental changes
- Check connections: Hover over handles to see data types or outputs
- Experiment freely: Changes are reactive and reversible
Next Steps
Now that you understand workflows, explore:
- Operators Guide - Deep dive into specific operators
- Data Guide - Working with different data types and transformations
- Animation and Rendering - Create animated visualizations
- Creating Operators - Build custom operators
Quick Reference
| Action | Shortcut |
|---|---|
| Add operator | Right-click or a |
| Delete operator | Select and press Delete |
| Pan canvas | Middle mouse drag or Space + drag |
| Zoom | Mouse wheel |
| Go up one container | u |
| Search operators | Start typing after pressing a |
| Play animation | Space (in timeline mode) |
| Toggle sidebar | Click sidebar chevron |
| Rename node | Double-click name in sidebar |
| Insert node into edge | Drag node onto connection wire |